Institutional-Grade Research,
Instantly Visualized
Turn any market question into data-driven reports and charts. Minara AI analyzes, validates, and visualizes insights in minutes.


How AI Research Works
Go beyond surface-level info. Minara's Deep Research engine acts as your personal analyst team, delivering comprehensive reports on any crypto project, stock, or market trend
Smart Research Flow
Ask complex questions (e.g., "Analyze Solana's ecosystem growth"). Minara plans and runs multi-source research automatically.
Vast Data Access
Connects to 50+ real-time tools covering market, on-chain, sentiment, and macro data.
AI Synthesis & Review
AI cross-validates sources to ensure accurate insights and clear structure.
Professional Outputs
Downloadable in PDF or shareable as web pages, complete with citations.
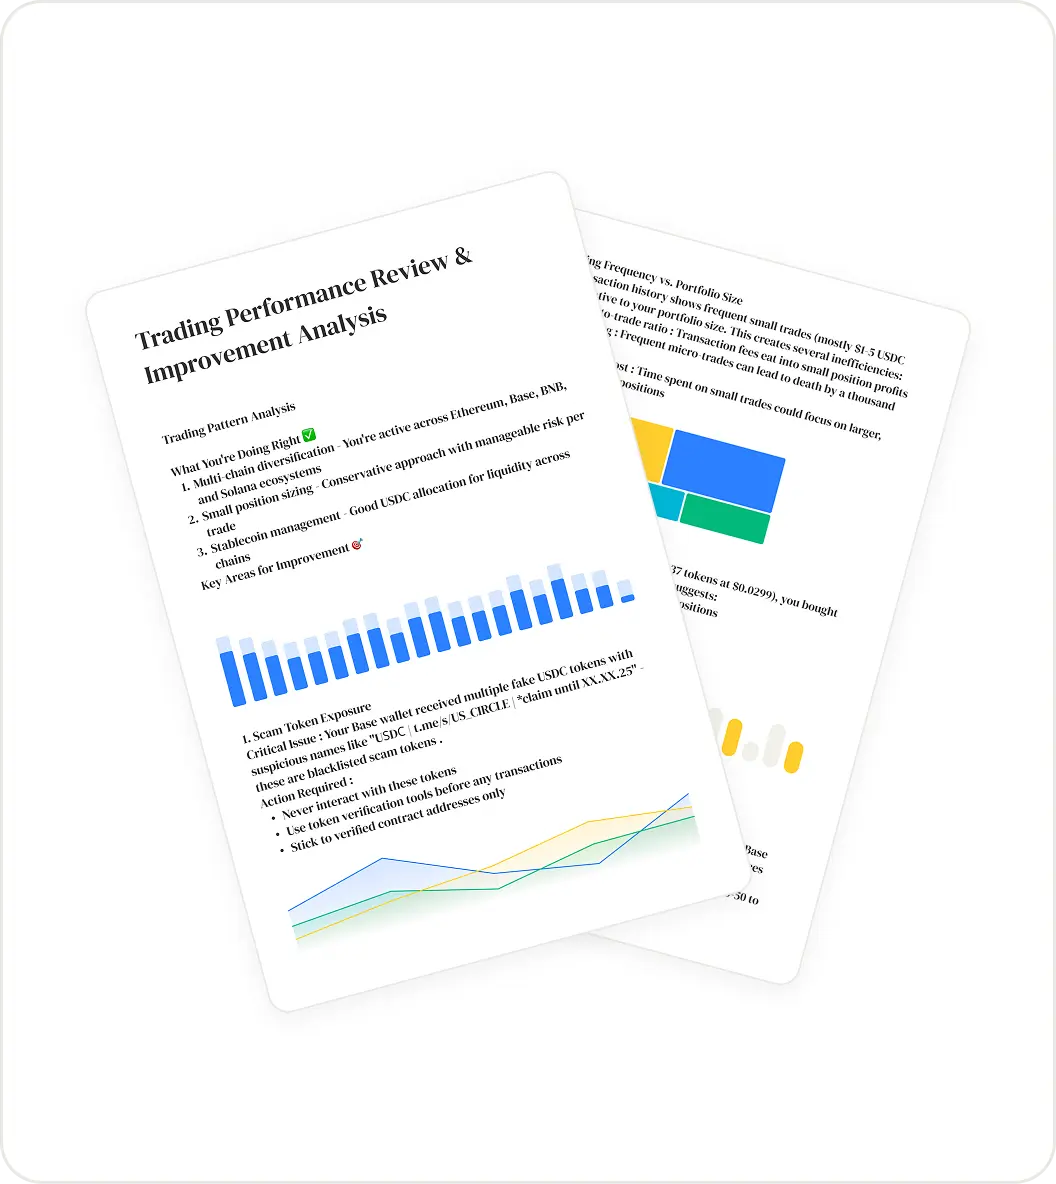
Data Speaks Volumes, Visually
Transform numbers into narratives. Generate insightful charts and structured tables directly from your prompts or analysis
Key Advantages
Deep Research Engine
Get automated, institutional-quality analysis on complex topics
50+ Data Sources
Access a vast ecosystem of real-time market, on-chain, social, and macro data
Instant Visualization
Create charts and tables effortlessly with natural language prompts
Rich Chart Library
Supports Line, Bar, Pie, Candlestick, Heatmaps, Sankey, Network graphs, and many more
Professional Reports
Receive well-structured research in PDF & HTML formats, ready to share
Visuals + Insights
Charts and tables are paired with AI analysis to highlight key findings
Unlock Deeper Insights Today 🔥
Leverage Minara's AI research and visualization tools to understand the market like never before. Start your first Deep Research or create a chart now